
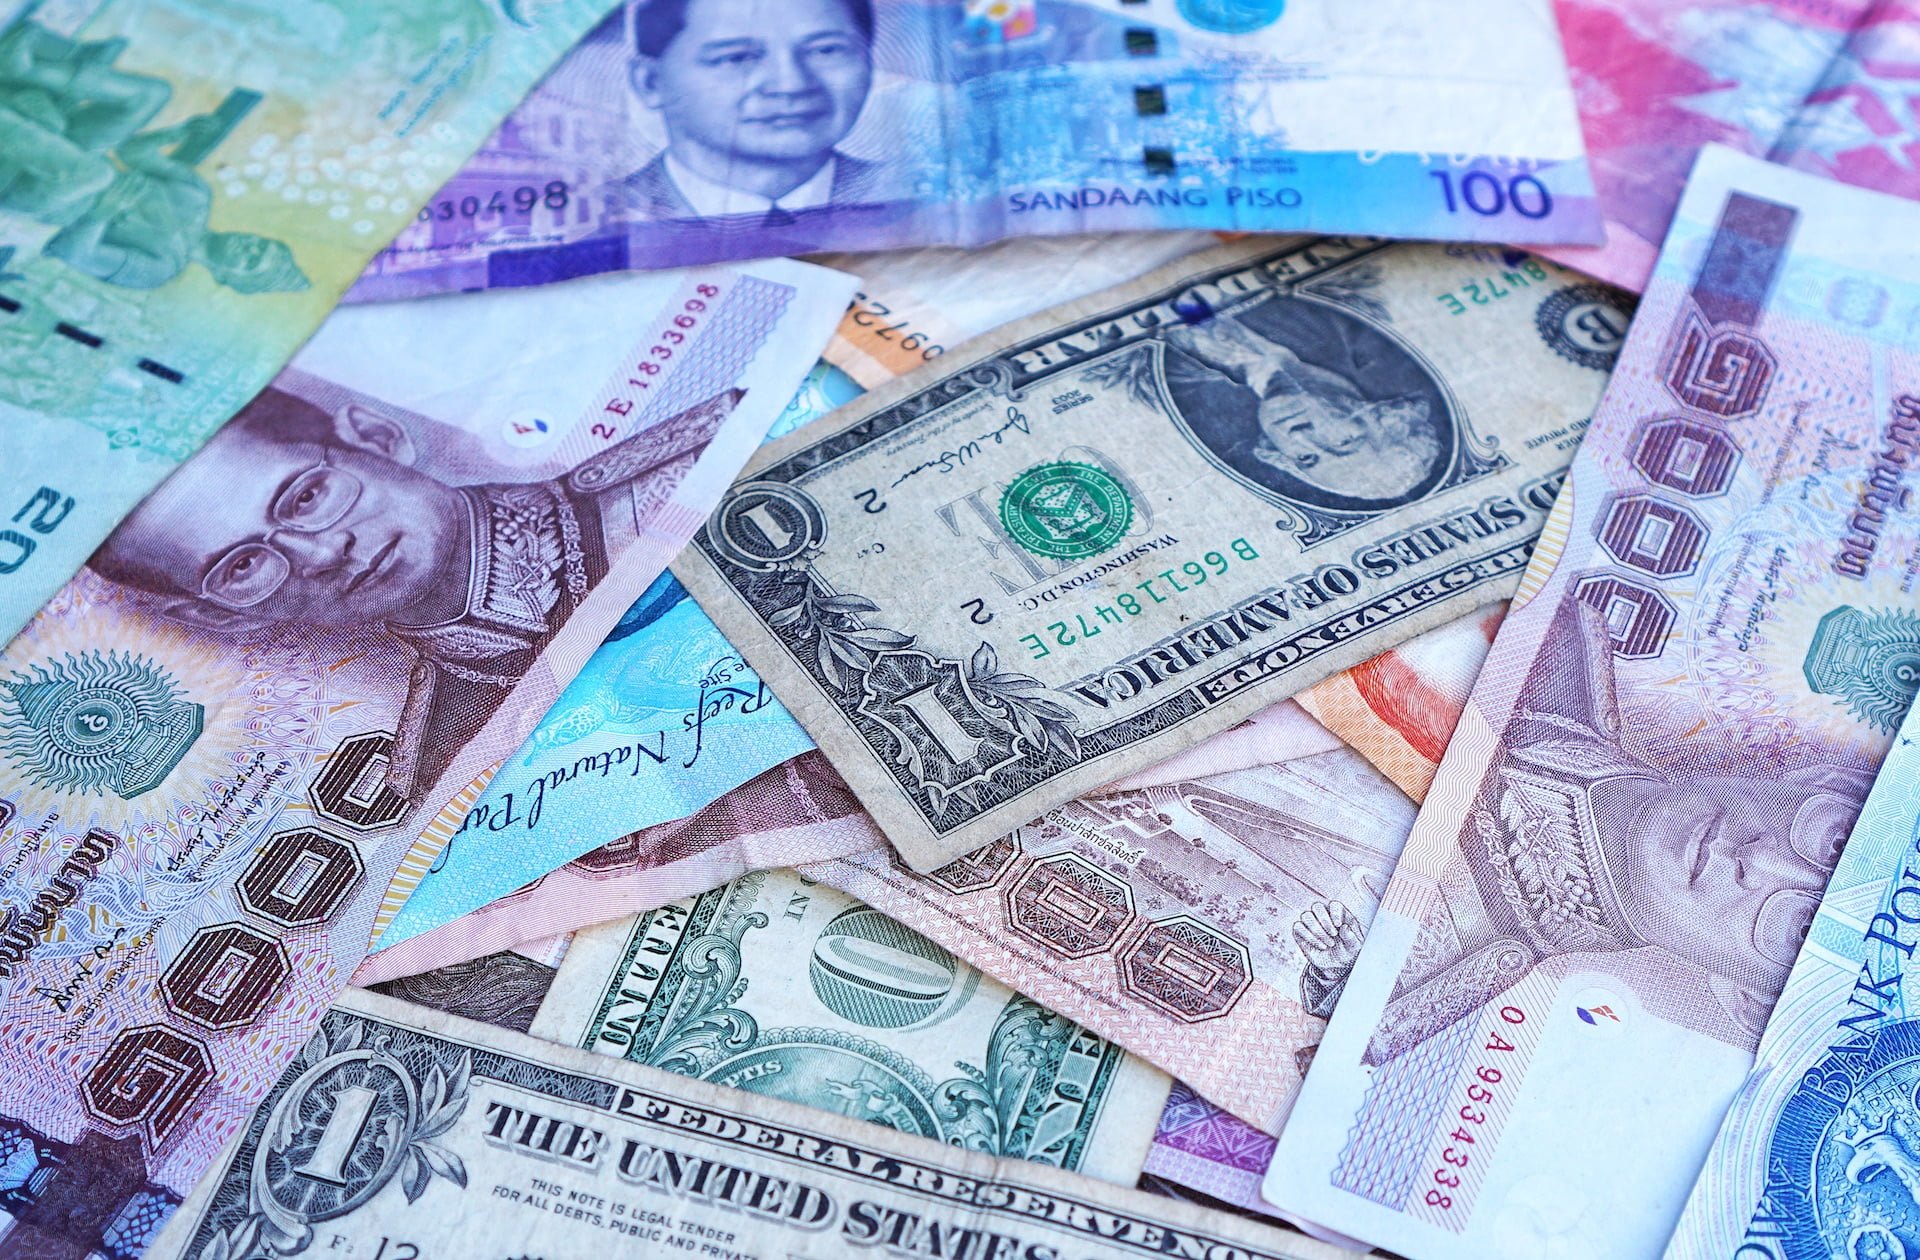
Whether traveling abroad or managing personal finances, foreign currency exchange (💱) between nations is essential knowledge worth mastering.
When exchange rates fluctuate—such as when the Japanese Yen drops significantly against the New Taiwan Dollar (NTD)—consumer behavior responds rapidly with travel surges, shopping sprees, and broader macroeconomic shifts across regional markets.
A nation’s currency exchange rate, whether high or low, directly connects to global economic structures. This guide compiles key concepts, historical pricing, and practical insights for foreign exchange transactions.
The international exchange rates displayed on domestic bank boards are often customized reference rates derived through local conversion mechanisms rather than direct spot market quotes. Aside from the US Dollar (USD), which serves as the primary base currency, conversions often pass through the USD first before reaching other currencies—frequently resulting in double exchange spreads captured by intermediary banking institutions.
Closely related to foreign exchange rates are foreign currency deposit interest rates. Higher interest rates naturally attract depositors, though monetary easing cycles often reduce deposit rates to encourage capital deployment and spur broader economic circulation.
10-Year Historical Highs and Lows for Major Foreign Currencies against NTD
From May 1, 2009 to April 28, 2019, key reference exchange rates for the New Taiwan Dollar (NTD / TWD) included:
- 🇺🇸 US Dollar (USD) to NTD: 10-year low of 28.57360 (May 2011); high of 33.70600 (Jan 2016).
- 🇨🇦 Canadian Dollar (CAD) to NTD: Low of 21.89387 (May 2017); high of 31.68644 (Mar 2010).
- 🇯🇵 Japanese Yen (JPY) to NTD: Low of 0.24718 (May 2015); high of 0.39917 (Sep 2011).
- 🇳🇿 New Zealand Dollar (NZD) to NTD: Low of 18.81217 (May 2009); high of 26.66461 (Jul 2014).
- 🇨🇳 Chinese Yuan (CNY) to NTD: Low of 4.35687 (May 2017); high of 5.21534 (Sep 2015).
- 🇪🇺 Euro (EUR) to NTD: Low of 32.19028 (Apr 2017); high of 48.75737 (Nov 2009).
- 🇬🇧 British Pound (GBP) to NTD: Low of 37.47003 (May 2017); high of 55.58752 (Nov 2009).
- 🦘 Australian Dollar (AUD) to NTD: Low of 21.29856 (Jan 2019); high of 32.19246 (Nov 2011).
- 🇨🇭 Swiss Franc (CHF) to NTD: Low of 27.61931 (May 2010); high of 40.15200 (Aug 2011).
- 🇸🇪 Swedish Krona (SEK) to NTD: Low of 3.23669 (Apr 2019); high of 4.79664 (Mar 2014).
- 🇹🇭 Thai Baht (THB) to NTD: Low of 0.86957 (May 2017); high of 1.04251 (Apr 2013).
- 🇭🇰 Hong Kong Dollar (HKD) to NTD: Low of 3.67412 (May 2011); high of 4.32501 (Jan 2016).
- 🇸🇬 Singapore Dollar (SGD) to NTD: Low of 21.43554 (May 2017); high of 24.38810 (Jul 2014).
- 🇿🇦 South African Rand (ZAR) to NTD: Low of 1.97748 (Jan 2016); high of 4.54645 (Dec 2010).
- 🇰🇷 South Korean Won (KRW) to NTD: Low of 0.02498 (May 2012); high of 0.02984 (Jul 2014).
- 🇵🇭 Philippine Peso (PHP) to NTD: Low of 0.55462 (Feb 2018); high of 0.73738 (Mar 2013).
- 🇮🇩 Indonesian Rupiah (IDR) to NTD: Low of 0.00202 (Oct 2018); high of 0.00358 (Aug 2010).
- 🇻🇳 Vietnamese Dong (VND) to NTD: Low of 0.00127 (Mar 2018); high of 0.00193 (Jul 2009).
- 🇲🇾 Malaysian Ringgit (MYR) to NTD: Low of 6.83527 (Mar 2017); high of 10.27282 (Sep 2010).
Reference data source: Bank of Taiwan Foreign Exchange Rates.
Foreign Currency Board Interest Rates
Foreign currency interest rates fluctuate constantly by institution. While individual retail banks may occasionally offer targeted promotional spreads, online spot exchange transactions via primary state banks like the Bank of Taiwan often provide straightforward execution with minimal hidden spreads.
Support Independent Perspectives & In-Depth Insights
Every thoughtful analysis and candid critique comes from our dedication to truth and quality. We choose not to follow sensational algorithms or clickbait headlines.
Sustaining independent research requires reader support. Make a one-time or monthly contribution, securely processed by Google.
Payments secured by Google · Manage or cancel anytime in your Google Account



Comments