
A single-month historical record chart of the exchange rate changes of the Japanese Yen (symbol ¥, Japanese Yen, abbreviated JPY) against the New Taiwan Dollar (NTD, TWD) for the entire month of March in ROC year 112 (2023 AD). The lowest value occurred on the 2nd, when 0.2275 could be exchanged for one New Taiwan Dollar.
March, ROC Year 112 Japanese Yen Exchange Rate Table
Listing DateCash RateSpot RateBank BuyBank SellBank BuyBank Sell2023/03/310.21950.23230.22680.23082023/03/300.22070.23350.2280.2322023/03/290.22150.23430.22880.23282023/03/280.22230.23510.22960.23362023/03/270.22270.23550.230.2342023/03/250.22380.23660.23110.23512023/03/240.22370.23650.2310.2352023/03/230.22260.23540.22990.23392023/03/220.22090.23370.22820.23222023/03/210.22250.23530.22980.23382023/03/200.22420.2370.23150.23552023/03/170.22040.23320.22770.23172023/03/160.22070.23350.2280.2322023/03/150.21760.23040.22490.22892023/03/140.220.23280.22730.23132023/03/130.21870.23150.2260.232023/03/100.21710.22990.22440.22842023/03/090.2160.22880.22330.22732023/03/080.21470.22750.2220.2262023/03/070.21610.22890.22340.22742023/03/060.21610.22890.22340.22742023/03/030.21540.22820.22270.22672023/03/020.21470.22750.2220.2262023/03/010.21560.22840.22290.2269
Japanese Yen (JPY) Cash Rate Buy/Sell Trend Chart for March 2023
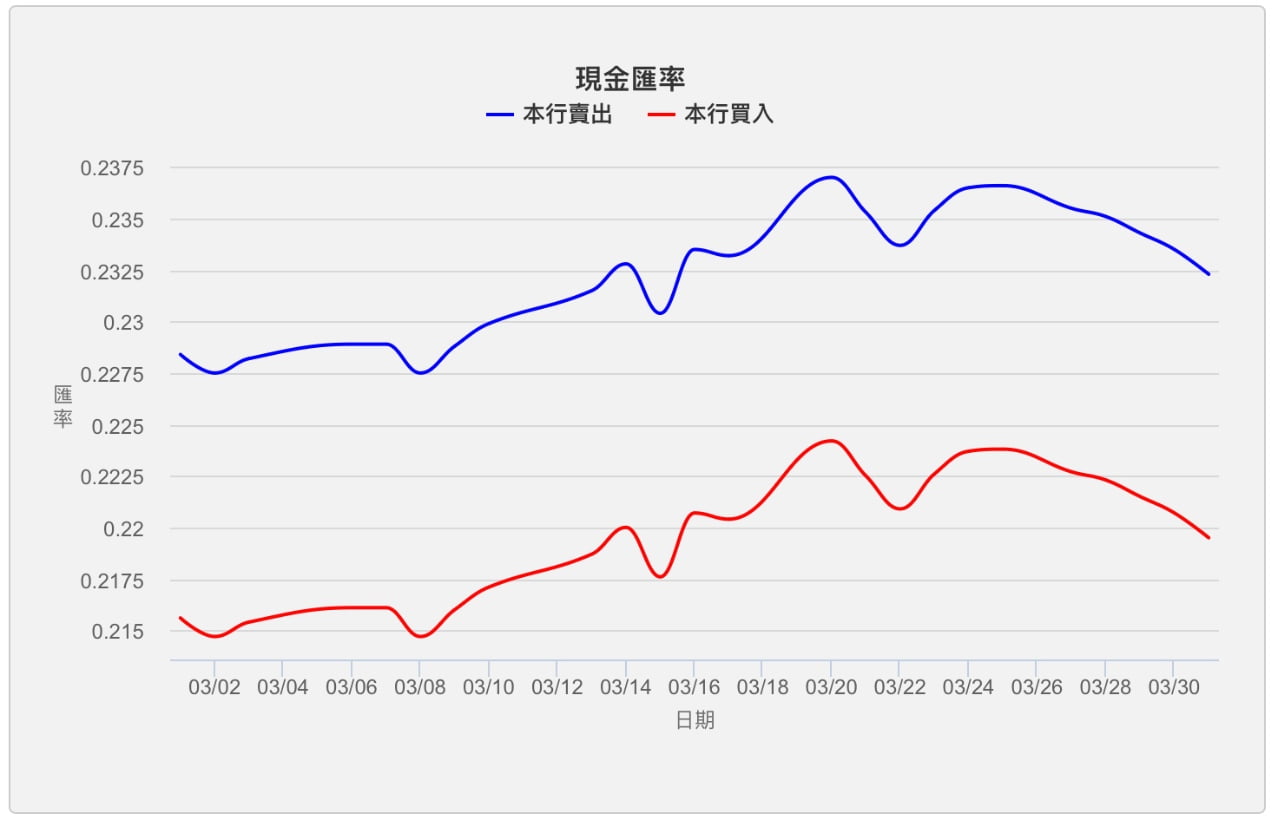 Japanese Yen (JPY) Cash Rate Buy/Sell Trend Chart for March 2023
Note: The data in this record table is for reference only and does not represent the actual transaction exchange rate; Source: Bank of Taiwan.
Support Independent Perspectives & In-Depth Insights
Every thoughtful analysis and candid critique comes from our dedication to truth and quality. We choose not to follow sensational algorithms or clickbait headlines.
Sustaining independent research requires reader support. Make a one-time or monthly contribution, securely processed by Google.
Payments secured by Google · Manage or cancel anytime in your Google Account

Comments