
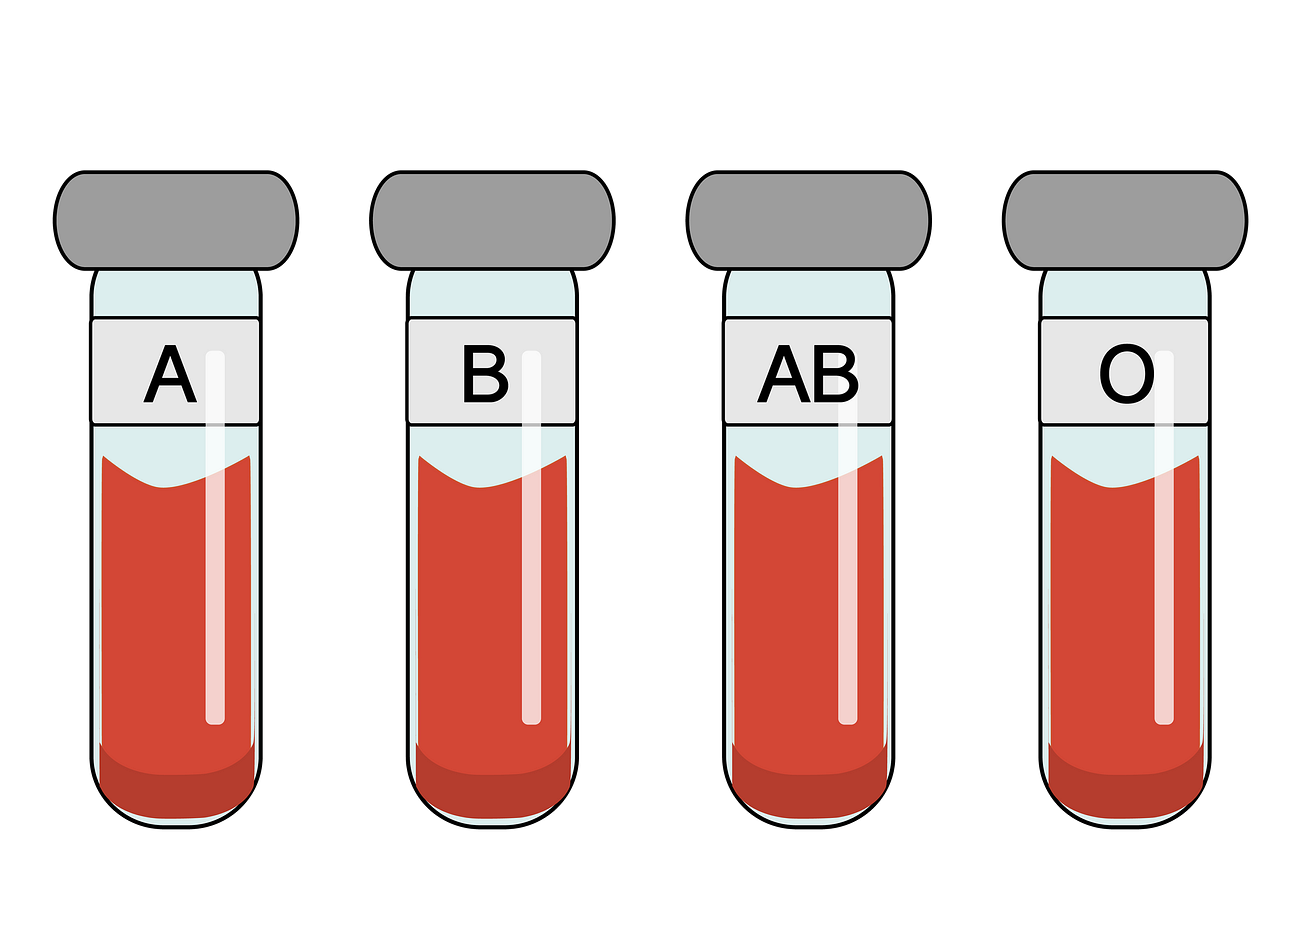
Across the world, distinct cultures, genetic heritages, and historical migrations have shaped the unique traits of nations and populations. Yet few biological markers are simultaneously as universally recognized and internally diverse as human blood types.
With advancements in modern hematology, population genetics, and epidemiology, our understanding of global blood type distributions and their evolutionary drivers has expanded dramatically.
According to recent global demographic datasets, the distribution of blood types among the world population exhibits intriguing patterns. These figures are far more than dry statistical values; they reflect complex evolutionary histories, genetic drift, and geographic adaptations.
In this article, we explore the distribution of blood types across humanity and analyze the multidimensional reasons behind these variations.
Global Population Blood Type Survey
- O-Positive (O+): 39.81% of the global population, making it the most prevalent blood type worldwide.
- A-Positive (A+): 27.40%.
- B-Positive (B+): 20.86%.
- AB-Positive (AB+): 5.65%.
- O-Negative (O-): 2.68%.
- A-Negative (A-): 2.10%.
- B-Negative (B-): 1.14%.
- AB-Negative (AB-): 0.37%.
Comparative Breakdown: Taiwan, China, Japan, South Korea, and the US
Taiwan (Republic of China, ROC) 🇹🇼
Across Taiwan, Penghu, Kinmen, and Matsu, type O blood is predominant, accounting for approximately 42.5% of the population. Type A stands at 26.5%, type B at 24.8%, while type AB is comparatively rare at 6.2%.
China (People’s Republic of China, PRC) 🇨🇳
In mainland China, type O is likewise the most widespread blood type at approximately 48%. Type A and type B account for roughly 28% and 19% respectively, while type AB represents only about 5.6%.
The regional distribution across East Asia shows considerable variation, yet type O consistently represents a major genetic backbone, largely influenced by ancestral migration and population genetics.
Japan 🇯🇵
Japan’s blood type composition features type O in a leading position at approximately 39.8%. However, type AB is noticeably more prevalent in Japan than in many other nations, reaching 9.9%, alongside substantial representations of type A (around 38%) and type B.
South Korea (Republic of Korea) 🇰🇷
South Korea displays a uniquely balanced distribution across the three primary blood groups, with type A, type B, and type O each comprising approximately 30% of the population, while type AB holds roughly 9.9%. Compared to most countries where one or two groups dominate, South Korea presents one of the most evenly distributed blood group profiles in the world.
United States 🇺🇸
In the United States, blood type diversity is heavily shaped by multiethnic demographics. Type O holds the largest share at roughly 37.4%, closely followed by type A at 35.7%, while type B accounts for 8.5% and type AB represents just 1.5%. The multifaceted cultural and racial composition of the US explains this distinct spread.
Blood Types and Regional Culture
Worldwide, different societies have attributed cultural significance to blood types.
In countries like Japan and South Korea, popular culture has embraced the “blood type personality theory”, which posits correlations between blood types and behavioral tendencies. This belief frequently permeates everyday life, romantic dating, matchmaking, and even hiring discussions.
Although mainstream medical science remains skeptical of any deterministic link between blood antigens and personality traits, the cultural impact of this belief remains remarkably strong across East Asia.
Blood Types and Human Health
Clinical evidence increasingly indicates correlations between ABO blood groups and susceptibilities to specific health conditions. For instance, epidemiological research suggests that individuals with type A blood may face marginally higher risks of cardiovascular diseases, whereas individuals with type O blood often exhibit lower risks of arterial thrombosis, but higher vulnerability to peptic ulcers caused by Helicobacter pylori.
Moreover, blood typing is indispensable to emergency medicine and transfusion protocols. Type O-negative individuals are universal red blood cell donors because their erythrocytes lack A, B, and Rh antigens, making them crucial donors during trauma resuscitations and urgent surgical procedures.
Consequently, precise tracking of regional blood type reserves enables public health institutions to optimize transfusion supply chains and disaster preparedness.
Factors Driving Blood Type Diversity
Why do blood type ratios differ so markedly across continents?
First, genetic inheritance and ancestral evolution: Blood group alleles have evolved over hundreds of millennia. Genetic drift, geographic isolation, and the founder effect explain why indigenous populations in the Americas, for example, have near-total frequencies of type O, while central Eurasia exhibits some of the highest concentrations of the B allele.
Second, pathogen exposure and natural selection: Evolutionary biologists hypothesize that historical pandemics played a decisive role in shaping blood group frequencies. For example, individuals with type O blood have demonstrated heightened resistance to severe malaria caused by Plasmodium falciparum, offering a survival advantage in equatorial regions.
Conclusion
The study of human blood type distribution is an interdisciplinary inquiry uniting genetics, anthropology, evolutionary biology, and clinical medicine. By investigating how blood group frequencies vary across the globe, we gain deeper insight into human resilience, adaptation, and our collective evolutionary journey.
Support Independent Perspectives & In-Depth Insights
Every thoughtful analysis and candid critique comes from our dedication to truth and quality. We choose not to follow sensational algorithms or clickbait headlines.
Sustaining independent research requires reader support. Make a one-time or monthly contribution, securely processed by Google.
Payments secured by Google · Manage or cancel anytime in your Google Account



Comments